QUOTE (investmart @ Jul 29 2010, 09:24 PM)
small correction: it's the opposite - the more leveraged you are the higher the cash on cash!
All,
I developed the following formula and shared here around 2 years ago:
ROI not incl. appreciation = {(CAP-i) /d} + i
Please note how the down payment % affects the COC% most. if for example you can somehow put 1/2x instead of x down (through VTB, different bank, etc.) you almost doubled your ROI or cash on cash%. therefore, we cant say 10% is not possible or 20% is not possible without asking the question how much down was put.
Hi Neil,
Thanks for the equation.
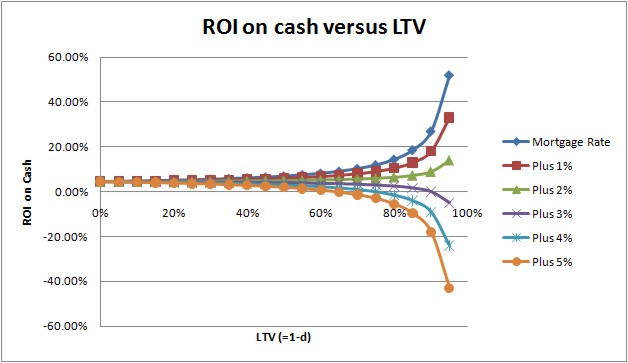
Very useful. I would like to point out some issues with ROI on cash and leverage, because with increased leverage ROI on cash does go up, but not in a linear fashion. It increases exponentially (see graph below).
Using your equation and a cap rate of 4.5% (pretty high for Calgary) and a (variable) mortage rate starting at 2%, I graphed your ROI on cash for various down payment/purchase price ratios (d=1-LTV). First I realized that with a high LTV (95%) you will need a lot of properties for it to have a significant impact on your total investment portfolio. Say you have $100,000 and your ROI on cash is a very attractive 20% with a LTV of 95%, you would need to own 10 properties (each with $10K down) to earn 20% on your entire portfolio. That is a lot of work, hassle and risk (leverage).
Secondly, if your variable mortgage rate increases from 2% to 3% (on the graph that is 'plus 1%), your ROI goes down significantly and when the rates increases further, you may get even a negative ROI on cash (and not just a little bit). If your rate goes from 2% up to 6% ('Plus 4%'), at a 95% LTV you suddenly have a negative ROI of 24% and at a mortgage rate of 7% the ROI on cash goes down to -43%,
Just trying to make life more difficult. Hope this helps.